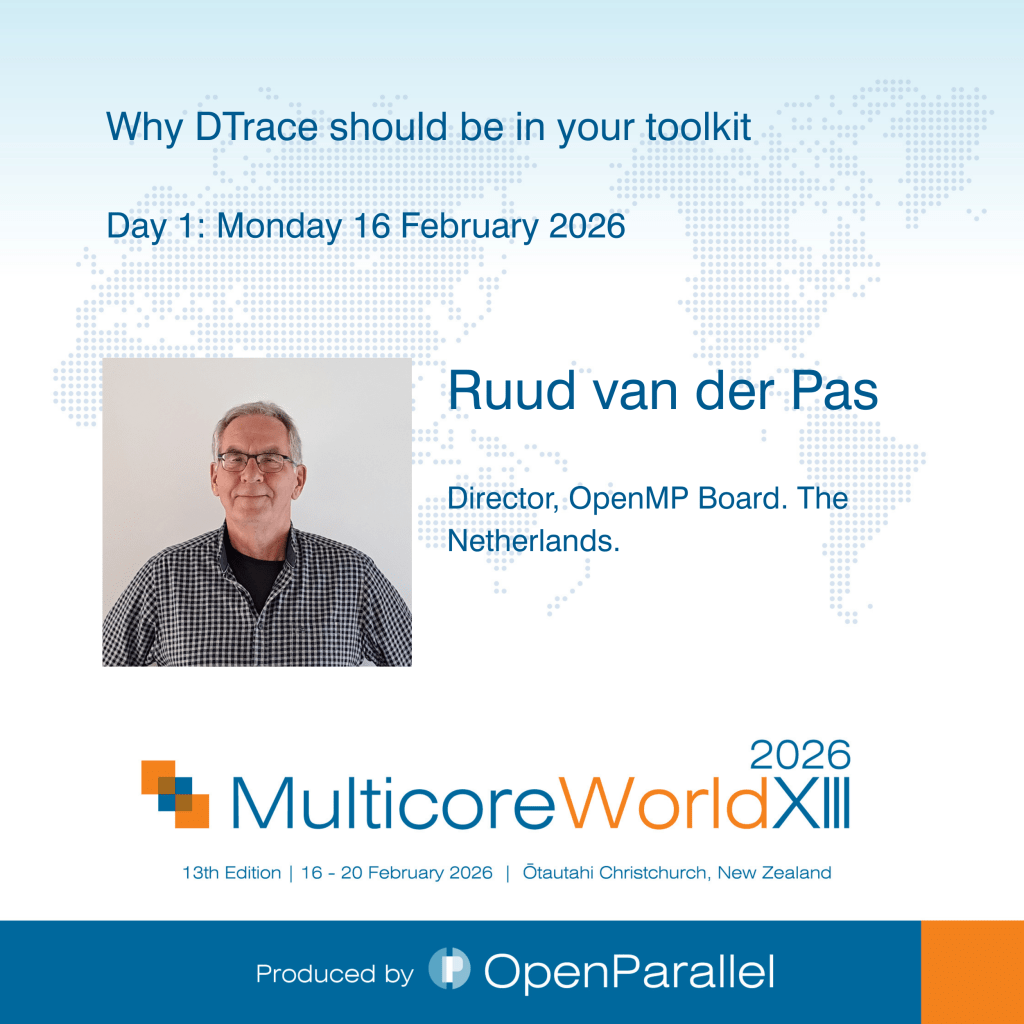
Director, OpenMP Board. The Netherlands.
“Why DTrace should be in your toolkit“
Monday 16 February 2026
Abstract
We all know of recent system outages that have been very disruptive. Such outages may occur on a large scale, as for example was the case with the Crowdstrike issue, or be relatively small with a profound impact. An airline check-in system that stops working for example. Obviously, in such cases, the first priority is to bring the system(s) back up and resume normal operations. However, the root cause of the problem needs to be found. Either immediately, or post-mortem. This is when troubleshooting tools come into the picture. And there are many, but are they sufficient to tackle all problems?
In a number of cases, the answer is affirmative, but those are what I would consider the relatively easy cases. It is already known where the problem originates, but more details are needed to find out what triggered the outage.
What if this isn’t all so clear cut? For example, how to find out what happened deep inside the system? Or, are multiple components interacting, causing the problem to appear at some unexpected point in the execution?
In such cases, the DTrace tracing tool comes to the rescue.
The more conventional tracing tools like strace, are very useful, but they typically target one area of the system. They provide a pre-defined set of options to somewhat customize the behaviour and output, but that is also as far as it goes. For one thing, it is very difficult to use multiple tools at the same time in order to get a more holistic view.
DTrace is different. More than anything else, it is a programming language, the “D” language, that has been designed for tracing. This =approach provides full flexibility and customization, also with respect to the output.
Through the program written in the D language, it is defined which events need to be monitored, the results that should be printed and when. Such a program is typically tailor-made for the problem at hand. As an aside, for those that worry another language needs to be learned, the D language looks very similar to those familiar with awk, or C. It has been augmented with additional powerful features, like aggregations and predicates. In addition to this flexibility, DTrace also very naturally supports an holistic view on what is happening in the system. For example one can monitor network related events simultaneously with I/O events. Through the support for wildcards in the event definitions, an even wider net can be cast.
In this talk, a short overview of DTrace is given. After a brief historical overview, some important concepts and main features are covered. The bulk of the talk consists of a practical example that demonstrates how to use DTrace and illustrates some of its key features.
Bio
Ruud van der Pas operates on a world-wide basis. His key area of expertise is in parallel computing, in particular on shared memory systems using OpenMP. He has been involved with OpenMP from the start and has extensive experience in highly scalable shared memory performance on various types of algorithms, including graph analysis.
He also regularly gives technical presentations and tutorials at conferences and workshops.
Ruud has studied mathematics and physics and has been involved with the performance of technical applications for 25+ years. Before joining Oracle he worked at Sun Microsystems, SGI, Convex Computer Corporation, the University of Utrecht and Phillips.
He is also a board member of IDC’s HPC Advisory Committee, regularly receives invitations to be on the program committee of international conferences and has a strong interest in Interval Analysis and Interval Arithmetic.
Ruud’s current area of interest is the gprofng application profiling tool that is part of the GNU binutils tool suite. In addition to his code development work, he is actively involved with the promotion of this tool, including giving presentations.
Ruud has published over 20 conference papers related to application tuning and parallelization, several technical white papers and is co-author of the books “Using OpenMP”, and “Using OpenMP – The Next Step”, both published by MIT Press.

MW26 Videos
MW26 Q & A
